Awhile back, I was working on improving site performance for a Drupal project and had difficulty understanding which parts of the code were causing bottlenecks. It was a fairly complex site with a lot of custom code. So, I decided to create a module to help out.
The site
The site had a lot of custom code for presentation and whole lot around their artwork collection. So there is a lot to comb through. We also were using Solr to index and search the collection. On certain pages, there was a lot going on. Pinpointing was not easy, and in the past it was easy to write it off as "Solr was the bottleneck", but I had no numbers to back that up.
My initial goals
- I wanted to be able to run this on the LIVE site, so it had to be somewhat lightweight.
- I needed to be able to measure times for different parts of the site all at the same time.
- I needed to be able to measure php as well as twig.
The process
First things first, I created a Drupal service, but quickly realized it would be difficult to track data from different instances of that service. So, I moved it out into a Singleton class to handle that. Some Drupal services I think are singletons, but I didn't figure that out just yet.
The one piece I'm pretty excited about finding and using was the 'kernel.finish_request' event. If I understand it correctly, and your server is configured correctly with fastCGI (more info on fastCGI), this event should run after the response is sent. Then, all the hard work, such as calculating times and saving to the database, can be done after the response.
Then another small fun piece was making this available in twig. For that I just created a Twig extension to bridge the functionality.
So here you can see an example of the different calls.
$tm = TimingMonitor::getInstance();

$tm->logTiming("preprocess_node:$bundle:" . $variables['view_mode'], TimingMonitor::START, "Starting...");
$tm->logTiming("preprocess_node:$bundle:" . $variables['view_mode'], TimingMonitor::MARK, "...Mark...");
$tm->logTiming("preprocess_node:$bundle:" . $variables['view_mode'], TimingMonitor::FINISH, "...Finishing");
This way, I can mark the start of something I am timing, different steps or parts in the process, and when it finishes. Here, I am testing preprocessing a node. The label structure, using the ':', gives me options for later filtering and grouping result types.
Results
For this first project, I quickly realized it was in fact NOT Solr that was causing the slow down, but actually Drupal rendering. I've been able to implement a few caching strategies to pre-cache that.
Here is an example report, evaluating how long a custom spellcheck function takes.
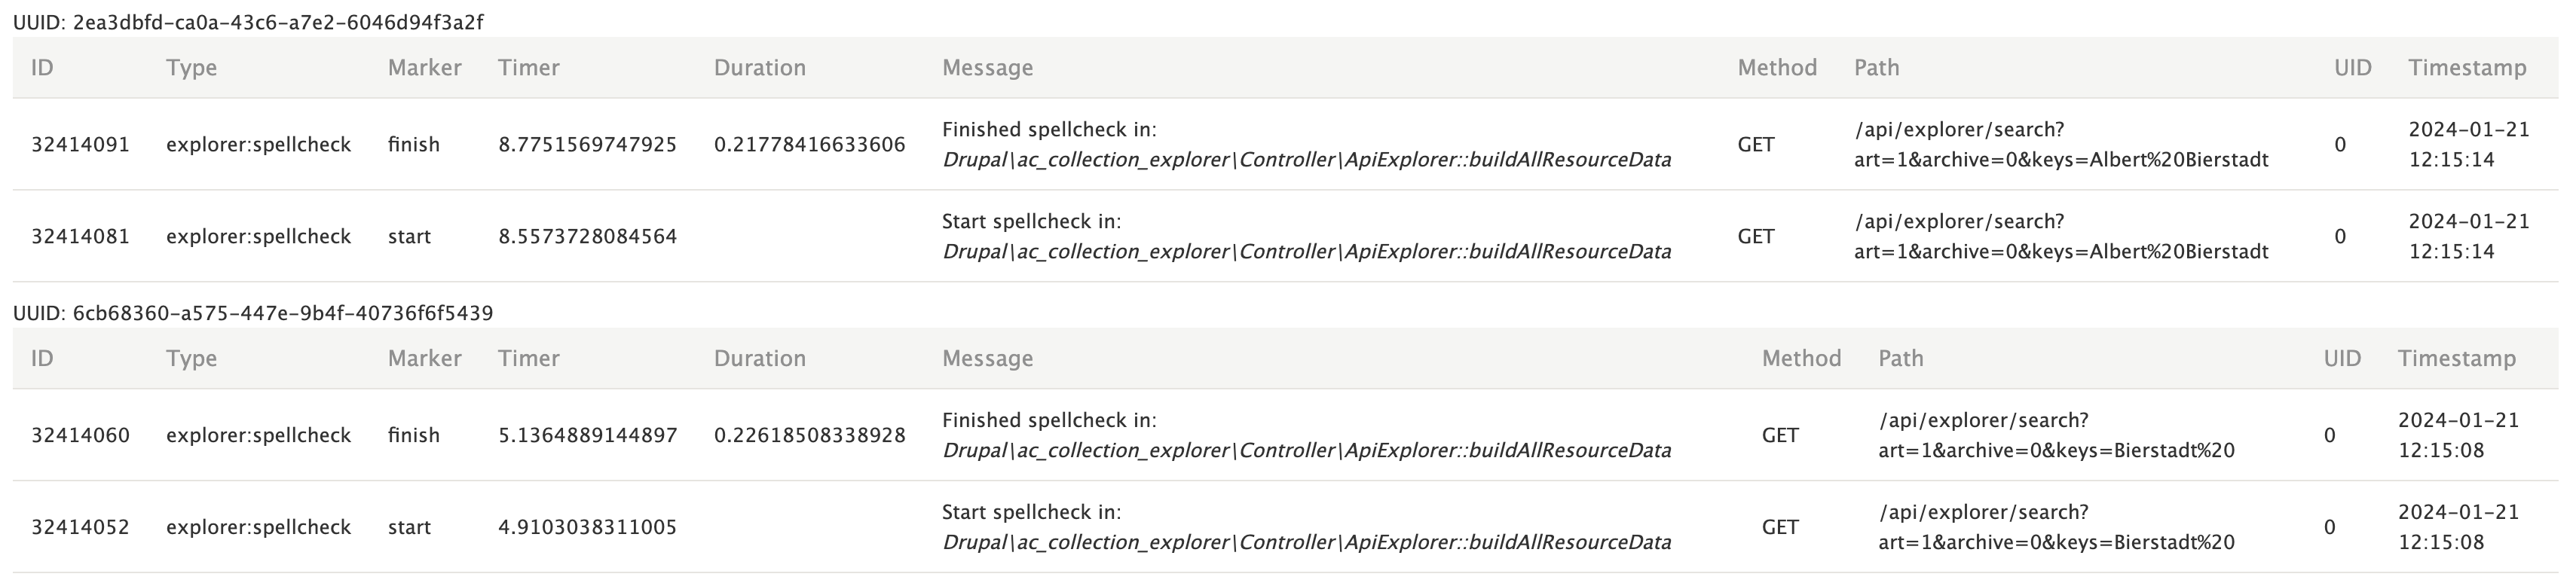
Just looking at this, with two different page loads and four entries, there are a number of things I can quickly infer to help improve the site. Someone was searching for a specific person. Their last name was not in the dictionary. Two action items here would be to add Artist names to the dictionary. The second would be to cache a spellcheck result, even if it is a minimal time. Users are probably tweaking their results and searching multiple times. By caching the spellcheck result, later searches will be slightly quicker.
Current module
I, of course, over-engineered it and added in drush commands and an api to be able to pull out results. You can take a look at the full module on GitHub, Timing Monitor.
Conclusion
Performance optimization is not my primary job, however I really had fun diving into this and trying to figure out how to do this well within Drupal. Plus, now I have a future tool to help with later projects.
